The scientist concept is just being damaged continously where ever they poke their nose in.
It seems to be more than just learning or studying but driven by an agenda that I wonder if driven by university inculation and control that probably goes all the way through the education system and into our very social structures and being.
I believe this is also done in global warming statistics and one just wonder where it stops.
How “Science” Counts Bears or Why it Takes a Village
by Jim Steele
The Inuit claim “it is the time of the most polar bears.” By synthesizing their community’s observations they have demonstrated a greater accuracy counting Bowhead whales and polar bears than the models of credentialed scientists. To estimate correctly, it takes a village. In contrast the “mark and recapture” study, which claimed the polar bears along South Beaufort Sea were victims of catastrophic global warming and threatened with extinction, relied on the subjective decisions of a handful of modelers.
In mark and recapture studies, the estimate of population abundance is skewed by the estimate of survival. For example, acknowledging the great uncertainty in his calculations of survival, in his earlier studies polar beat expert Steven Amstrup reported three different population estimates for bears along the South Beaufort Sea. If he assumed the adult bears had an 82% chance of surviving into the next year, the models calculated there were 1301 bears. If survivorship was 88%, the abundance climbed to 1776 bears. If he estimated survivorship at a more robust 94%, then polar bear abundance climbed to 2490.1 Thus depending on estimated survival rates, a mark-and-recapture study may conclude that the population has doubled, or that it has suddenly crashed.
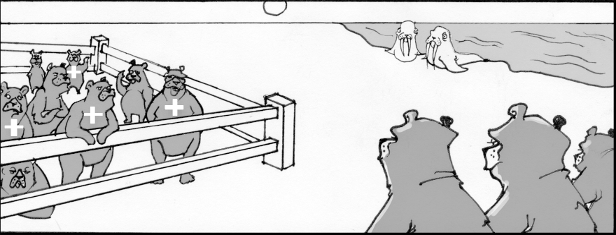
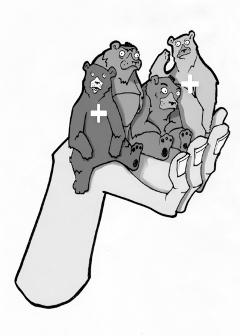
Here are the simplified basics of estimating survival for any animal (brown bears in the cartoon, but this applies to polar bears too). In the cartoon assume the fenced-off area is your study area. For statistical reasons you ignore observations outside that designated area. During the first year, you reach into your study area and capture four bears , which you then mark by painting a big white cross on their chests. (Researchers first painted big numbers on polar bears for easy identification from a helicopter, but the tourism industry complained that it ruined photographs. They now use discreet ear tags and a tattoo under their upper lip in case the tag falls off.)

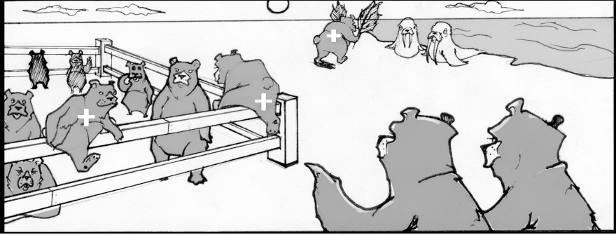
The next year you return to your study area and randomly capture four more bears. However, only two are marked with a white cross. Now the researcher must decide what happened to the two missing bears that were marked last year. Did they die or did they avoid detection? Assuming they avoided detection, then survival is estimated to be 100%. Since the two recaptured bears representhalf of last year’s marked bears, the models assume the four bears captured during the study’s second year similarly represent about half of the total population. So the models estimate that there were at least eight bears within the study area.

However the calculations change if the researcher assumes the missing marked bears died. In this case, it means that in the second year you captured every possible marked bear. So your model assumes that you also captured every possible bear in the study area. Now the model estimates that there were only about four bears living in your study area. Because the survival rates are greatly affected by this guesswork, these estimates are called “apparent survival rates.”
Apparent survival rates are heavily biased by any migration in and out of the study area. The earliest mark and recapture models were tested on rodent populations, and the statisticians warned that barriers should be erected to prevent the rodents from moving. Otherwise all statistical calculations were totally unreliable. But that tactic is impossible for highly migratory polar bears.

Unlike other species that defend a territory with reliable resources, polar bears never defend territories. They walk and swim across great distances and will congregate wherever the Arctic’s ever-shifting food supply becomes most abundant. A study of radio-collared female bears denning on Wrangel Island determined that after the bears left the island they traveled an average distance of about 3700 miles.2 Although much of their travel is confined within a less extensive region, one radio-collared female was observed in Alaska in late May and tracked to Greenland by early October.3 Such wide-ranging movements allow rapid adjustments to the Arctic’s annually varying food supplies. However it presents great difficulties for any mark and recapture study. Deciding if a bear was traveling or died thus becomes guesswork, and the amount of guesswork increases with shorter studies.
Instead of erecting barriers, a small percentage of female bears are equipped with radio collars. (Males have such big necks the collars will slide off. Young bears outgrow their collars too quickly and could choke themselves to death. So typically only adult females are collared.) Because collared bears can be tracked, there is no guesswork unless the batteries die. If a radio-collar remains in one spot for a long time, researchers locate the collar and determine if the bear died or just lost the collar. The vastly more accurate survival-rate data produced by collared bears is called “biological survival”. Researchers normally use biological survival to evaluate the accuracy of “apparent survival”. For example, if a large percentage of collared bears survived but simply moved out of the study area, then researchers assume a similar percentage of marked bears had also moved away. In that case, a low apparent survival rate was an illusion due to temporary migration and the avoidance of detection, not death.
Amstrup diligently followed up his earlier study on the apparent survival of South Beaufort Bears using radio-collared bears over a 12-year period. It turned out that his high-end apparent survival estimate of 94% was still too low. If only natural deaths were used, polar bears had a 99.6 % biological survival rate.4 Most bears died at the hands of hunters. If death at the hands of hunters was also considered, then biological survival was still higher than apparent survival, but fell to 96.9%. In 2001 Amstrup concluded that the South Beaufort Sea population was increasing and the current hunting quotas insured a growing population.
To appreciate the magnitude of the problem in estimating apparent survival rates, imagine a human mark-and-recapture study in which the local supermarket is your study area. For statistical reasons, you can only use observations inside your defined study area to determine whether or not your neighbors are alive or dead. (Because you recognize your neighbors’ faces, there is no need to add ear tags or body paint.) How often do you see your neighbors in that store? Although my neighbors and I shop at the same supermarket 2 or 3 times each week, 50+ weeks a year, I don’t see 90% of them at the supermarket more than once every 5 to 10 years. If I was doing a human mark and recapture study, and did not see my neighbors after 5 years, my model would assume most of my neighbors had died! For that reason mark and recapture studies must persist for several years in order to estimate the probability of marked animals being alive but not observed. Otherwise they will underestimate survival. Amstrup warned, “Models that predict rapid increases or decreases in population size would not mirror reality”
Perhaps it was the growing pressure from adversarial lawsuits, and speculation that the polar bears were endangered from CO2 warming, but in a subsequent series of USGS publications coauthored by Amstrup, they suddenly emphasized the illusion of apparent survival and downplayed biological survival to suggest the polar bears were facing extinction. The study was far too short to reliably estimate survival. Still during the first three years of their “extinction” study, the researchers reported apparent survival ranging from 92?99%. The higher estimate was the same as the biological survival rates of Amstrup’s radio-collared bears. However apparent survival dropped dramatically for the last two years of the study. The final years of a study always underestimate survival because newly marked are less likely to be observed a second time relative to bears marked in the first years of a study. Claiming “radiotelemetry captures present methodological difficulties” they oddly excluded radio-collared data from critical statistical tests!5 Despite knowing that biological survival rates had never rapidly changed before, and despite knowing more collared bears migrated outside their study area in 2004 and 2005, the USGS report argued polar bear survival had abruptly dropped from 96?99% in 2003, down to 77% in 2004.6
In their first USGS report, the authors demonstrated high integrity in their analysis and were upfront about the problems of their models, writing, “the declines we observed in model-averaged survival rates may reflect an increase in the number of “emigrants” toward the end of the study, and not an actual decrease in biological survival”, and they noted male bears had exhibited unusually high transiency.5 When apparent survival rates were high, only 24% of the collared females had wandered outside the study area. In contrast, during last two years of the study when apparent survival plummeted, the number of collared bears wandering outside the study area had nearly doubled to 47% in 2005 and 36% in 2006, but they never published their biological survival rates. They chose to dismiss the high percentage of bears migrating out of the study area and subjectively chose to argue fewer captured bears meant more dead bears. The authors oddly argued that using 18 years of data the bears are eventually observed in the study area. In keeping with my human/supermarket analogy, it was the equivalent of labeling all your neighbors dead if you don’t see them in the market over a two year span, because over a ten year period you always see them at least once. We need Steve McIntyre to do a polar bear audit!
The dramatic drop in survival meant 400 bears suddenly died but there were no carcasses. To support their unprecedented claims, one USGS report emphasized in the abstract that subadult males showed reduced body condition and that was evidence of nutritional stress that lowered survival.7 However if you read the results section and did some math, you discover that subadult males only represented 5% of all captures. The other 95% were stable or improving. In contrast, adult females represented about 34% of all captures, and despite being under the most stress due to an eight-month fast while giving birth and nursing their cubs, their body condition had improved. That good news wasn’t ever mentioned in the abstract, you had to search the results section: “There was no trend in mass of adult females during the study, but the mean BCI [body condition index] of females increased over time”.7
Their abstract also implied “a decline in cub recruitment” to support their model’s uncharacteristic dip in survival rates. But that too was an illusion. Recruitment compares the number of cubs in the spring with the number of cubs in the fall. Using older studies their observed results found that the number of cubs per female had increased between 1982 and 2006 during the spring. This would be expected. When the female body condition increases, they usually produce more cubs.8 To counteract that good news, the authors then argued there was a decline in cubs during the fall, and thus a decline in recruitment. However they had not surveyed in the fall since 2001.7 They were using deceptive zombie data to support a bad model.
That is how global warming advocates counted bears to refute the claims of the Inuit. That was the driving evidence that led to the uplisting of the polar bear as threatened species. Based on such studies Dr. Derocher, chairman of the IUCN’s Polar Bear Specialist Group (PBSG) warned, “It's clear from the research that's been done by myself and colleagues around the world that we're projecting that, by the middle of this century, two-thirds of the polar bears will be gone from their current populations”.
Don’t count on it!
Literature Cited
1. Amstrup, S. C., Stirling, I., and Lentfer, J. W. (1986), “Past and Present Status of Polar Bears in Alaska,” Wildlife Society Bulletin, 14, 241–254.
2. Garner, G. et al. (1994) Dispersal Pattersn of Maternal polar bears from the denning concentration on Wrangel Island. Int. Conf. Bear Res. and Manage. vol. 9, p. 401-410.
3. Durner, G., and Amstrup, S. (1995) Movements of a Polar Bear from Northern Alaska to Northern Greenland. Arctic, vol. 48, p. 338– 341
4. Amstrup, S. and Durner, G. (1995) Survival rates of radio-collared female polar bears and their dependent young. Canadian Journal of Zoology, vol. 73. P. 1312?1322.
5. Regehr, E.V., Amstrup, S.C., and Stirling, Ian, 2006, Polar bear population status in the southern Beaufort Sea: U.S. Geological Survey Open-File Report 2006-1337, 20 p.
6. Regehr, E., et al. (2010) Survival and breeding of polar bears in the southern Beaufort Sea in relation to sea ice. Journal of Animal Ecology 2010, 79, 117–127
7. Rode, K. et al. (2007) Polar Bears in the Southern Beaufort Sea III: Stature, Mass, and Cub Recruitment in Relationship to Time and Sea Ice Extent Between 1982 and 2006. USGS Alaska Science Center, Anchorage, Administrative Report.
8.Derocher, A., and Stirling, I., (1998) Offspring size and maternal investment in polar bears (Ursus maritimus). Journal of Zoology (Lond.) vol. 245, p.253–260
Adapted from the chapter Inuits and Illusions in the Time of the Most Polar Bears
in Landscapes & Cycles: An Environmentalist’s Journey to Climate Skepticism, by Jim Steele.
Essay first posted to Watts Up With That as How “Science” Counts Bears, guest post by JimSteele, Director emeritus Sierra Nevada Field Campus, San Francisco State University
Essay also reposted at Polar Bear Science

No comments:
Post a Comment